

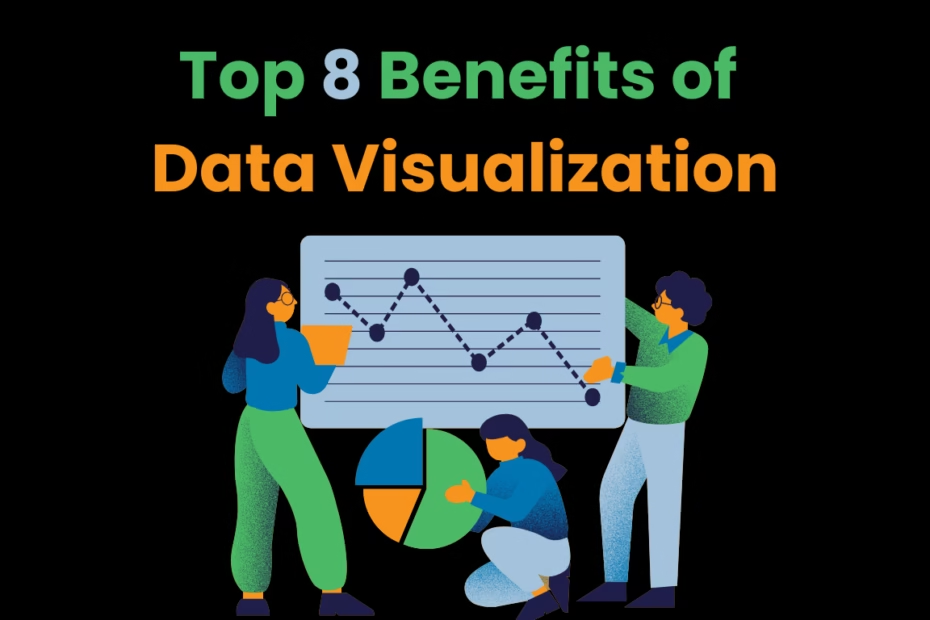
Data plays a vital role in the decision-making process. Companies rely on data analysis to strategize and implement marketing techniques that will improve their brand’s position. However, raw data is often misleading and unnecessary. This is where data visualization comes in. Data visualization converts complex datasets into visually appealing and understandable formats. By presenting information in ways people can understand more easily, data visualization helps people gain a clear picture and make informed decisions.
Enhancing Comprehension
Converting raw data into datasets isn’t the only benefit of data visualization. Data visualization is a tool that improves understanding of the collected data. With the help of charts, graphs, and maps, you can make it easier to understand complicated data. With Power BI, users can visualize data to spot trends, patterns, and outliers that may remain hidden. Improved clarity means stakeholders can make faster, data-led decisions.
Improving Collaboration
Data visualization plays a major role in helping communication by providing visuals that simplify the raw text. Visuals can act as an in-between for a layperson and complex datasets when data is being shared with a team, client, or executive. By facilitating clear and concise communication, data visualization ensures everyone is on the same page, enhancing collaboration and alignment.
Accelerating Decision Making
For marketing and sales-driven companies, speed is a vital factor. Decision-making becomes much faster when you can find all the relevant information within reach. Data that has been formatted and can be visually interpreted as a conclusion allows decision-makers to reach conclusions quickly. This acceleration is important in fast-paced industries where decisions made on time can make or break the business.
Increasing Engagement
Data visualization also improves and increases engagement. Interactive and attractive presentations will grab attention better than dry numbers or pages and pages of reports. When audiences are focused and engaged, they retain knowledge better and participate in conversations. Visualization helps people connect better with information. It makes data more interesting and encourages active participation.
Transforming Complicated Data
Data often contains layers of complexity that can be difficult to understand. Simplifying this data can help companies gather information and key insights. Visualization allows large datasets to be broken down into manageable pieces, enabling users to prioritize what matters most. Similarly, tools like abstract management software can simplify the overwhelming process of managing conference submissions and reviews, helping academic organizers focus on key content and decisions. This approach makes it easier for people to process and retain information while reducing cognitive load by simplifying complex concepts.
Spotting Trends and Patterns
Recognizing patterns and trends is important for planning strategies. Data visualization plays a key role in this process. It helps to show emerging patterns and trends, which supports decision-making. Organizations can use these insights to anticipate changes, adjust their strategies, and remain competitive in their industry.
Enabling Data Storytelling
You can convey a lot through storytelling, and this impact grows even stronger when combined with data visualization. Visuals help illustrate the data’s journey and guide the audience throughout the narrative. This combination can evoke emotions, inspire ideas, and sway audiences effectively. It enables organizations to communicate their vision and values, using data to reinforce their narrative.
Enabling Real-Time Analytics
In business landscapes where market trends can change quickly, real-time data analysis is crucial. Most data visualization tools come equipped with real-time update capabilities. This feature allows users to track changes as they happen, providing stakeholders with instant information. As a result, rapid decision-making becomes easier and more accurate. Many of these processes can be conducted in real-time, enabling you to anticipate the decisions needed to respond swiftly to evolving situations.
Read More: How To Handle Dynamic Data in Regression Testing Tools?
End Note
The extent and specifics of data visualization can be immensely valuable in how we perceive, communicate, and consume data. It enhances comprehension, fosters effective interaction, and accelerates decision-making, among other benefits. When you combine all these features, you create a powerful tool that allows organizations to visualize their data, leading to smarter, strategic decisions. This process simplifies complex information, identifies patterns, and supports storytelling. Effective data visualization can provide significant competitive advantages, where data is increasingly recognized as a key factor for success.